Basics of Process Memory Layout and Virtual Addressing
Every program running on Linux exists in the form of a process. A process is an execution unit whose runtime context is managed by the kernel through internal data structures. Here, “execution context” includes everything required to resume execution, such as CPU register state, the program counter (PC), and memory state (stack/heap/global variables). Each process has its own execution context, and Linux uses it to perform context switching and scheduling.
In this post, we will analyze the virtual address space that holds a process’s execution context, using practical examples.
This post is based on Linux, and the test environment is as follows.
- OS: Ubuntu 24.04
- Kernel: 6.8.0
- GCC: 13.3.0
This post is an experiment-driven record analyzing a Linux process’s virtual address space. It explains the fundamentals, but also covers verification steps and limitations, so it targets readers interested in systems programming rather than absolute beginners.
Virtual Address vs. Physical Address
To understand Linux processes and address spaces, we should first distinguish virtual addresses from physical addresses. In modern computers, programs are tightly coupled with the CPU and memory. That is because the CPU ultimately operates by reading data from memory, computing, and writing results back. The execution context we mentioned earlier is also stored in memory. Linux separates virtual and physical addresses for efficiency, safety, and flexibility in memory management.
Physical Address (PA)
A physical address refers to an address that can access real hardware memory.
At the hardware level, RAM is physical memory, and physical addresses are used to access it.
For example, in a 32-bit system, addresses are represented with 32 bits, so in theory the addressable range is from 0x0000_0000 to 0xFFFF_FFFF.
In an OS environment, user programs generally do not access physical memory directly due to security and safety concerns.
This is why the concept of virtual memory and virtual addresses exists.
Virtual Address (VA)
A virtual address is a memory address that appears independent for each process. When a process is created, it receives a virtual address space and operates only within that range. Because each process has its own virtual address space, different processes may have the same virtual address values. This can be observed more easily when ASLR (Address Space Layout Randomization) is disabled or under certain conditions.
The key point is that even if virtual addresses look identical, they may map to different physical addresses.
For example, the address of variable a in process A and the address of variable b in process B may print the same value.
Even in that case, it does not mean the two variables point to the same location in physical memory.
process_A.c
int a;
printf("%p", &a);
process_B.c
int b;
printf("%p", &b);
Note: Addresses Printed in GDB Are Virtual Addresses
All addresses printed by a process running in user space are virtual addresses. The same applies to addresses printed in GDB. For example, in a GDB session, when you print the address of a variable
(gdb) p/32x &local_var
&local_var is an address within the process’s virtual address space (a virtual address).
Process Memory Layout
Every Linux process loads its code and data into a virtual address space provided by the OS.
This virtual address space is typically described as several well-known regions (segments/areas).
In general, each process has an isolated virtual address space, but some parts (such as text segments or shared libraries) may share physical memory.
| Segment | Description |
|---|---|
| text | Stores compiled executable code |
| data | Stores initialized global and static variables |
| bss | Stores uninitialized global and static variables |
| stack | Stores LIFO data such as local variables and function arguments |
| heap | Dynamic memory allocation region (e.g., via malloc()) |
When a program is compiled, the compiler and linker generate a binary that includes layout and size information for code and data. On Linux, this binary is typically generated in the ELF (Executable and Linkable Format).
In a future post, we will examine the ELF format in detail and verify how its sections/segments map into the process’s virtual address space.
Inspecting a Process’s Virtual Address Space
When a process is created, the Linux kernel assigns it a unique identifier called a PID (Process ID).
The file /proc/[pid]/maps contains the virtual memory mappings of the process.
$ cat /proc/[pid]/maps
The goal of this post is not to explain the full syntax of the maps file, but to observe and verify how real code is placed in the virtual address space. Still, we will briefly cover three key points required for this post.
The command below prints the memory maps for the cat process running in the current shell context.
$ cat /proc/self/maps
Virtual Address Range (Start ~ End)
The first column in the maps file shows the virtual address range in the form start-end.
Permissions
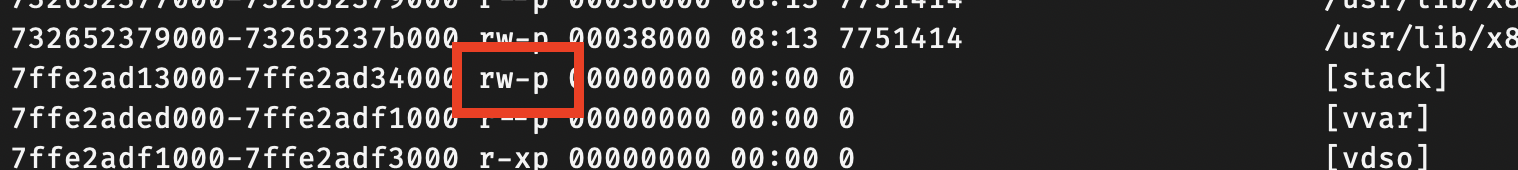
Each virtual memory region has its own access permissions.
Permissions are typically shown as rwxp, meaning read, write, execute, and private.
For example, r--p indicates a read-only region, where data such as string literals may reside.
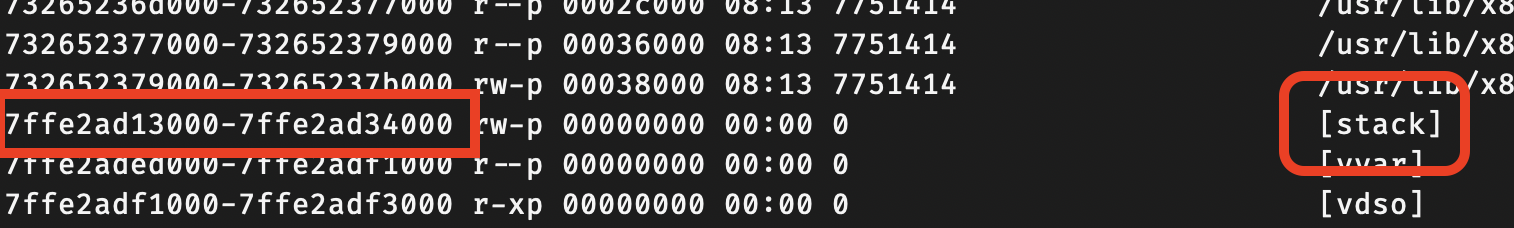
Mapped File Path / Region Type
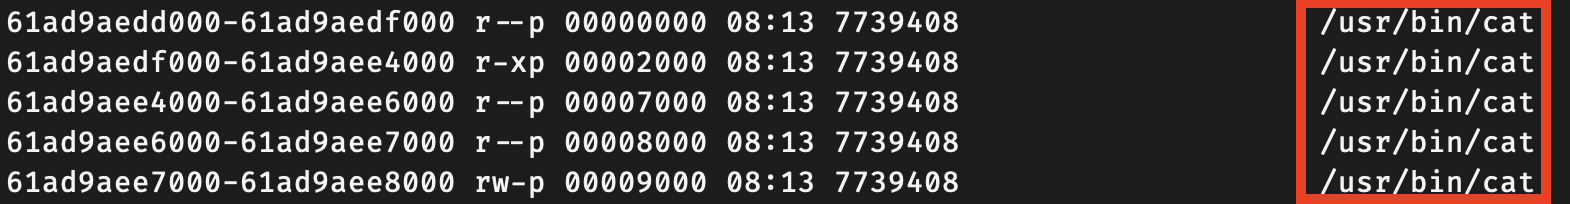
The last column shows the mapped file path, shared library paths, or region types such as [heap] and [stack].
For more details on /proc and how to read the maps file, refer to the manual page.
$ man 5 proc

Experiment
In this experiment, we will directly check where common program elements are placed in the virtual address space.
#include <sys/types.h>
#include <unistd.h>
#include <stdio.h>
#include <stdlib.h>
#include <string.h>

char global_var;
char init_global_var = 'A';

void print_maps(void) {
  FILE *f;
  char buf[256];

  f = fopen("/proc/self/maps", "r");
  while (fgets(buf, sizeof(buf), f))
      fputs(buf, stdout);
}

void foo(char a) {
  printf("[%p] address of the parameter in function\n", &a);
}

int main(void) {
  int local_var;
  int *malloc_var;

  print_maps();

  printf("[%p] address of the local variable\n", &local_var);

  malloc_var = malloc(sizeof(int));
  printf("[%p] address of the variable allocated by malloc()\n", malloc_var);

  printf("[%p] address of the function\n", foo);
  foo(1);

  printf("[%p] address of the uninitialized global variable\n", &global_var);
  printf("[%p] address of the initialized global variable\n", &init_global_var);

  return 0;
}
Compile & run:
$ gcc main.c & ./a.out
Output:
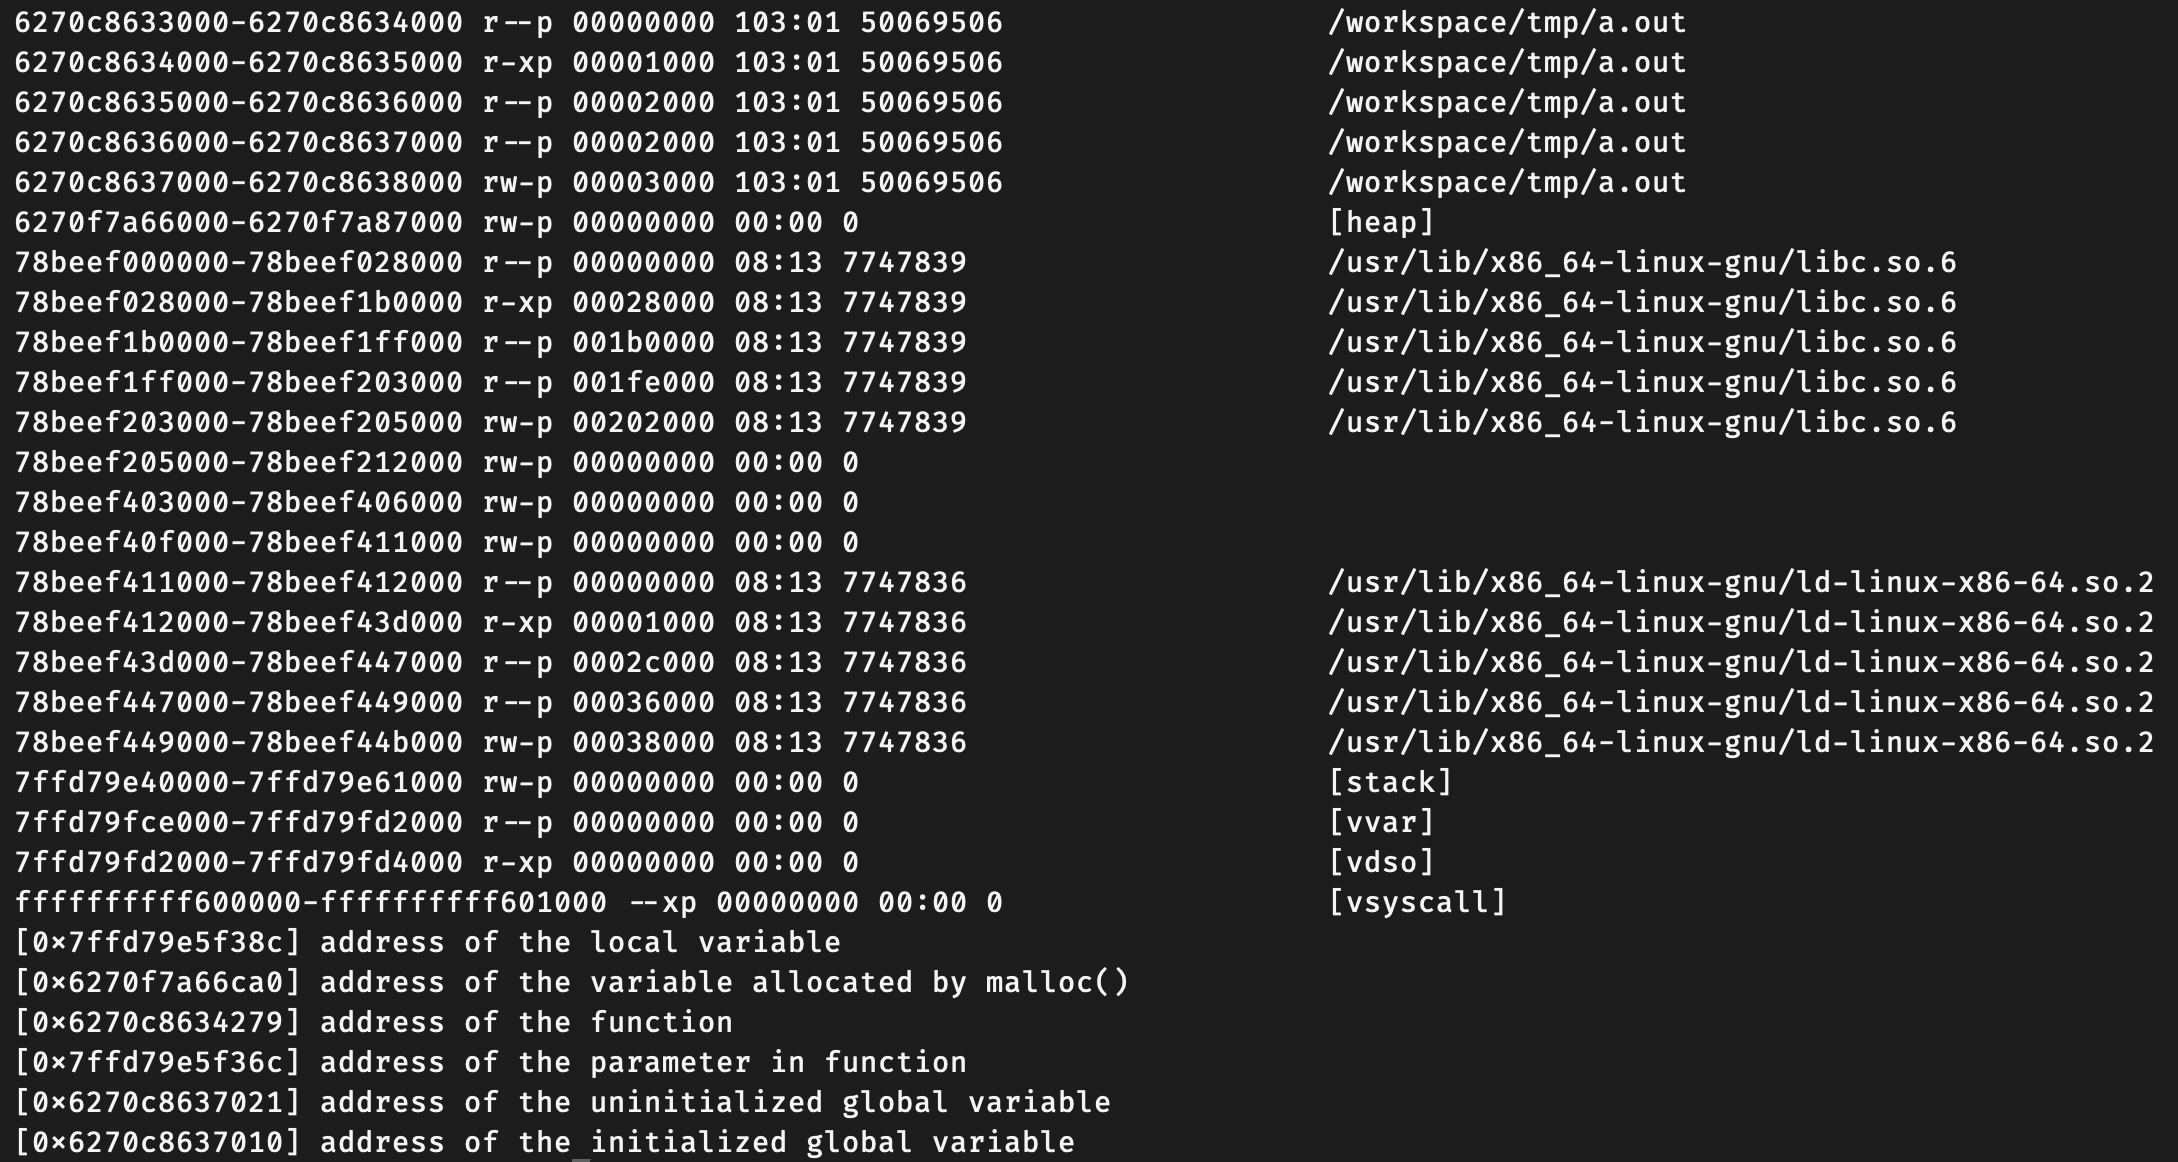
Result Analysis
The sample prints addresses for the following items.
- Address of a local variable in
main() - Address of memory allocated by
malloc() - Address of a function
- Address of an uninitialized global variable
- Address of an initialized global variable
By comparing printed addresses with the ranges in /proc/[pid]/maps, we can summarize them roughly as follows.
| Item | Symbol/Address | Estimated Region |
|---|---|---|
| Local variable | local_var |
stack |
| malloc allocation | malloc_var |
heap |
| Function address | foo |
text |
| Function parameter | a |
stack |
| Uninitialized global | global_var |
bss (estimated) |
| Initialized global | init_global_var |
data (estimated) |
However, /proc/[pid]/maps alone cannot directly distinguish whether a global variable belongs to .bss or .data.
We can observe that the address belongs to the executable-mapped region, but proving it at the section level requires ELF analysis.
This will be refined in a follow-up post focused on ELF analysis. Also, depending on the compiler and ABI, function arguments may be passed via registers and then spilled onto the stack.
Typically, small allocations often come from the brk-based heap, while larger allocations may use
mmap()to create separate mappings. A more detailed experiment comparingbrkandmmapwill be covered in a future post.